High Level Architecture
The following high level architecture diagram shows Case Management System.
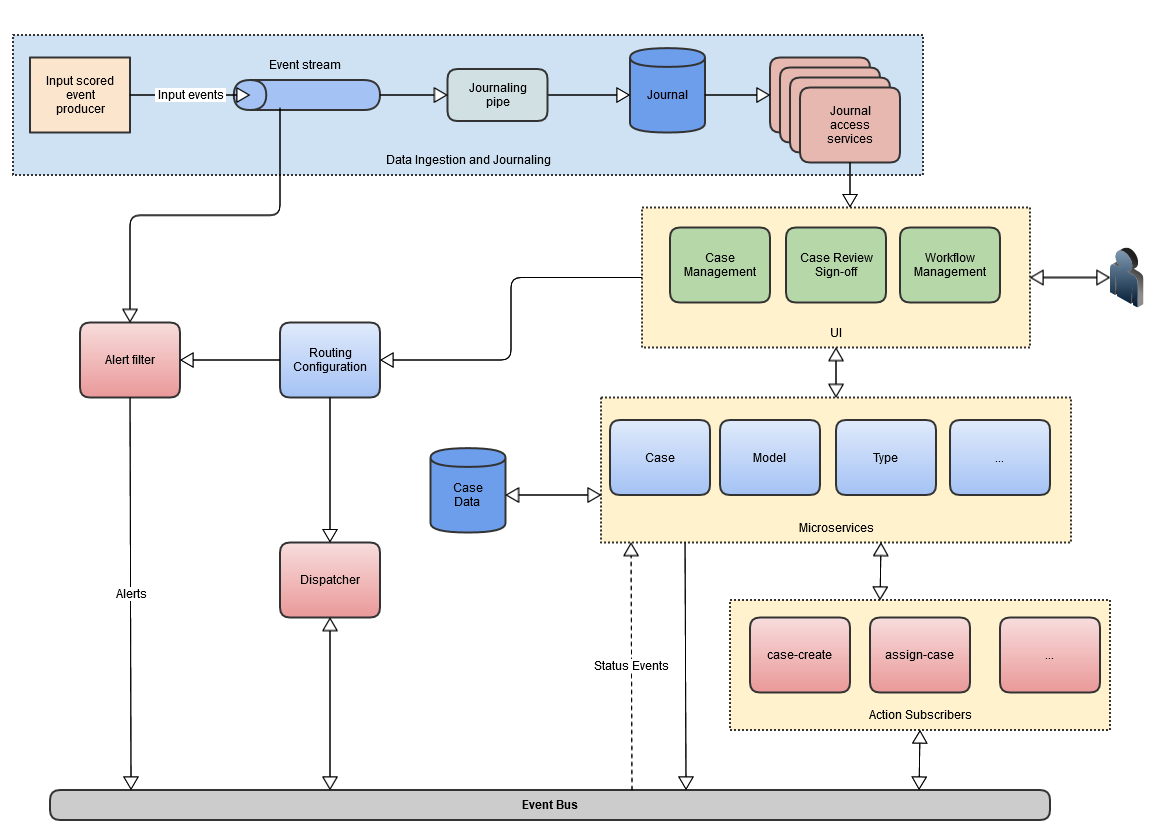
The main areas of functionality are:
Search Transaction
Each case under investigation has a seed transaction – the transaction that triggered the case’s creation. It may also have other transactions attached to it. Transactions are automatically added, according to configured system criteria. You can manually add additional transactions to a case, using the Transactions page. Search transaction feature is used to search transactions for a PAN with additional filters. This search is performed on athena table which reflects the data stored in data-lake. All scored transactions published on kafka are available in this data-lake.
- Data Lake - Transactional that has been processed by the scoring platform, stored in S3 and organized by date.
- AWS Glue Crawler - An ETL process that crawls the data lake and updates an AWS Athena table schema and metadata.
- AWS Athena - A severless interactive query service for analyzing the data in S3 using standard SQL.
Case Management System
Case Management System supports the investigation and assessment of high-risk subjects and their transactions. It includes a customizable, automated case creation engine, and tools supporting manual case creation, investigation, and assessment. Your Case Management system has been configured to investigate Personal Account Numbers (PAN) transactions for possible credit card fraud. Features include:
- Automatic case creation, based on a transaction’s score and prior subject history.
- Cases are routed to queues, according to configurable routing logic.
- Automatic routing of transactions to existing cases.
- Role-based case assignment.
- Case toolset, including timestamped tasks, case status changes, assignment events, case priority changes.
- Support for adding and viewing file attachments to cases.
- Case allocator / management tools, including configurable performance dashboards.
Dashboard
The Dashboard service allows users to generate dashlets that indicate the numbers of cases and alerts over a selection of time period. The dashboard service uses CubeJS which uses PostgresSql to query case related data.
- CubeJS - An analytical API platform providing data querying, caching, pre-aggregation, security and orchestartion for business intelligence.
- Highcharts - An interactive javascript charting library for displaying report aggregations graphically.
CubeJS
CubeJS provides the API layer for reporting. It is also responsible for access control, caching, and data aggregation. CuebJS periodically queries AWS Athena, and pre-aggregates data into an external PostgreSQL database. Front-end report queries performed via the cube client API return cached data from the Postgres database.
CubeJS uses a cube schema for modeling the raw data. A cube typically represents a table of data, and is composed of the following:
- Sql - The SQL query used to generate a table that will be queried, e.g.
select * from users - Measures - A measure is an aggregation over a particular column in the table, e.g. userCount
- Dimensions - Attributes related to a measure, e.g. country, age, gender, etc.
- Pre-aggregations - Materilized query results stored as tables.
Please see Dashboard for details.